Follow DRNO on...


Online Panel provider Netquest has announced the launch of a data visualization solution providing rapid reporting and analysis using infographics, tables and charts.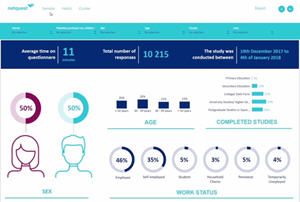 The 'Netquest Visual Data solution' starts with a cilent meeting to discuss requirements: based on this, a customized dashboard is created, and training provided to help clients get the most out of it. Netquest says the tool can be adapted to 'any type of market research project', including ad hoc, tracker, brand equity, customer experience, employee satisfaction, mystery shopping and U&A.
The tool supports advanced time series handling; moving average, weighted time series, hide empty date gaps, and consistent series colors as default functions. Users can automatically cluster brands to one series, easily follow sub brands, and combine structured quant and unstructured data.
Europe MD Marc Smaluhn (pictured) comments: 'Today's world is more visual than ever. This panorama demands new solutions to adapt out-of-date market research reports to the new needs in a visual, and immediate way'.
Headquartered in Barcelona and with its origins in panels in Spain and Latin America, Netquest now has panels in the United States, Germany, France, Italy and the UK.
The firm is owned by GfK and is online at www.netquest.com .
All articles 2006-23 written and edited by Mel Crowther and/or Nick Thomas, 2024- by Nick Thomas, unless otherwise stated.
Register (free) for Daily Research News
REGISTER FOR NEWS EMAILS
To receive (free) news headlines by email, please register online