Lida has over 20 years� experience in brand and advertising research, and has developed extensive knowledge of brand positioning and strategy, brand and advertising tracking, communication pre-testing and brand communications development. One of her main responsibilities at Harris Interactive is consulting with clients to ensure that actionable insights are delivered across all sectors.
Consumer choices are nowadays often portrayed as battles between rational and emotional sides - and in the case of a new car purchase, both might be expected to muster considerable armies. In this article, Harris Interactive's Lida Walsh details one approach to making sense of the melee...
17th June 2013
I want a new car. But I have no idea which one. When I bought my tiny Ford Fiesta three years ago, I just wanted something practical, small and easy to maintain for the commute to and from the office. But now, to be honest, I am a little bit bored with my overly practical car. I�d like something with a little more � well � spark.
I would usually classify myself as a very practical person and a bit of a traditionalist. But it is not always true. When it comes to fashion, I am willing to spend a lot of money on things that have a little more �edge� to them. But when it came to the washing machine I had to replace the other day, I didn�t really care what I got as long as it worked. Most of us have probably sat in focus groups and listened to similar views from consumers. So, how can marketers better understand what their brand strengths are and if they are really addressing consumer needs in the right way?
At Harris Interactive UK, we have worked with many clients across a broad range of different categories and sectors to research consumers� attitudes towards brands, and understand the rational and emotional drivers at work within the category.
We have applied the methodology to both B2B and B2C organisations and across diverse sectors including, but not limited to, Automotive, Charities, Entertainment, Financial Services, FMCG, Gaming, Media, Technology and Telecoms, and have seen it work across all these target groups.
Mapping consumer needs and values
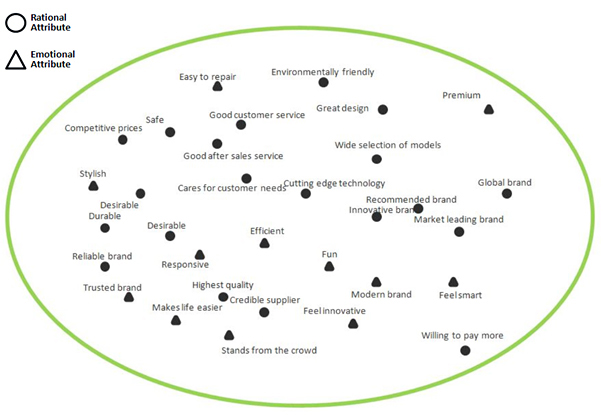
Firstly, we aim to understand what it is that consumers are seeking from the specific category in which a brand is competing and scope out what that really looks like. To do this, we investigate and identify the rational and emotional needs and values that consumers are seeking from the category. We then establish the relationship between these rational and emotional needs, and create a needs map, which serves as a great tool for delivering insights in a simple way.
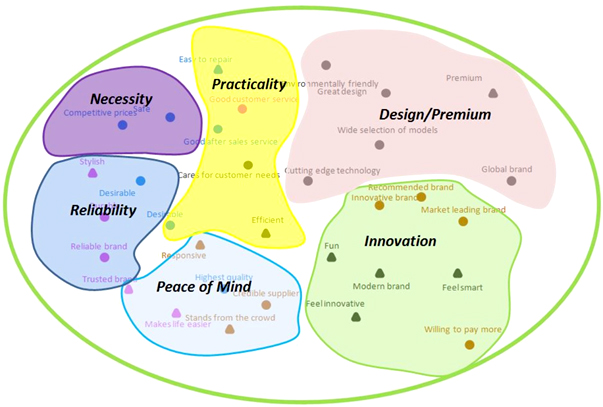
Using the map it is then possible to identify patterns and in the example below we see some patterns related to a car category. There are areas of needs concentrated around a common theme of practicality � an important consideration for me when I first bought a car. There are also other areas of importance such as necessity, design, reliability, innovation or having peace of mind.
Mapping also helps analyse how important each of these needs are and which of these are �driving� consideration.
There are needs that people would say are important to them, but they do not necessarily drive consideration (we call them top of mind needs, or hygiene
factors). Therefore, when choosing a new car, the practicality needs are still important and may be rated highly � fuel economy, size, reliability, safety. But, when it comes to the final decision, an individual may be led by their heart; the �va, va, voom� effect, no doubt. (These are very often emotionally-driven decisions � latent
motivators.) So, as long as the car performs on these top-of-mind needs, it should be suitable. Ideal attributes score well on both stated and derived importance.
Simple colour coding of these different needs makes it easy to decipher the map.
The most important drivers (pink and brown) are spread in an L-shape to the left and lower middle area of the map. An ideal brand would like to compete in these areas because these attributes drive the consideration of a brand the most. Within the automotive industry these are attributes such as trust, reliability or good brand reputation.
As a brand manager I�d be interested to know where my brand would be positioned on this map and where it fits in relation to competitor brands.
We have to bear in mind that brands within a category compete together and should not ever be taken in isolation. For example, producing more fuel-efficient engines is now a �must have� for every motor manufacturer. So, if all brands are improving, then improved ratings for one brand does not necessarily mean the brand is doing much better, unless these ratings are much higher than for the competitor brands. Generally, what it means is that there has been very little movement in relation to other brands and it is now an expectation within the category.
There are also other factors that affect brand perceptions and that is why we pre-treat the data to avoid these effects such as:
Size of the brand: Mass markets brands are very often overrated, while �niche� brands are underrated. We�ve all seen spider charts where a big brands� line is on the edge and small brands are squeezed in the middle.
Closeness
to
the
brand: For example, people who own a brand or just recently purchased the brand tend to rate the brand higher than those who are just partially familiar with it.
Attribute
importance: People tend to rate some attributes higher than others, just because they seem to be more important for them. In the automotive industry example, rational attributes such as safety, efficient fuel consumption and reliability will be attributes rated relatively higher across all the brands, while other attributes, usually emotional, will be rated relatively lower across all brands.
So, having taken these aspects into account, we can now create the brand footprints.
The example below shows examples of brand footprints and are identified as the green areas. Each brand footprint clearly occupies a different area on the map. However, when looking at my target market segment needs (attributes within the black outline), we can see that Brand 2 is a very close match. We can also see the strength of the brand footprint � not only by checking if the footprint contains at least some of the important drivers, but also provides a direction for brand stretch or repositioning to either improve the �match� with the target segment or reinforce the brand if important drivers are not present.
So, I�m still looking for my next car. But if I belonged to the target segment highlighted on the map and Brand 2 is communicating how it ticks all my boxes, there�s no doubt I�d be more likely to consider that car brand ahead of others. It�s a perfect match for me.