Keeping it RealHow Socio-Demographic Segmentation Can Keep Pace With the Changing Faces of Communities
18th January, 2012
Geodemographic segmentation provides precise information and an in-depth understanding of the different types of people in a location. There are a number of systems that provide categories to describe these �types� including our own ACORN classification, which segments small neighbourhoods, postcodes, or consumer households into five categories, 17 groups and 56 types.
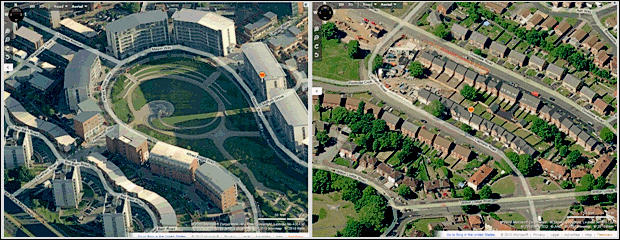
The challenge for analysts is to ensure that our segmentations are as responsive as possible to the changes that take place in these locations. Consider these two images of separate development projects from Bing maps.
 Source: http://www.bing.com/maps/
The picture on the left shows a large development in the centre of Birmingham. The neighbourhood has been demolished and a large number of new properties developed. The style of property has changed dramatically and consequently so has the nature of the residents.
The picture on the right shows the development of executive detached housing as part of a regeneration project by Birmingham council and the clip below, which shows a visit to the area, describes how it is 'almost unrecognisable since the redevelopment'.
http://www.youtube.com/watch?v=WS1G8awsDMI
This development is a significant change to a neighbourhood typically characterised as occupied by younger blue-collar workers and low-income starter families.
The challenge for segmentations of residents and consumers is to correctly follow such changes. It�s a serious challenge because they are not rare. Perhaps a quarter of local neighbourhoods (streets) have changed merely in terms of the numbers of people living there. Other streets have changed as the mix of residents has changed.
There is a two step problem for researchers. Firstly we have to spot that change has happened. Secondly we need to understand the nature of that change.
The generic source of detail about local populations is the national census. This is only carried out once a decade, and government may not be willing to fund it being carried out in the future, so it is of little use as a source of information about areas that have changed after it has been conducted.
Meeting the challenge
So how might we address the problem of keeping local socio-demographic data and thus consumer segmentations up to date?
We should recognise that change is often localised and so national data sets may not always be the answer. A good starting point is the ability to identify where change is happening. Once we know we can focus our efforts to understand change on the places that matter.
Luckily some change is easier to recognise. Housing demolition and house building may show up in a number of databases. For example, analysis of the Postal Address File, which is the UK�s most up-to-date and complete database for addresses and postcodes, can provide good indications of changes in individual streets.
Similar information can be inferred from Land Registry reports of both transactions and sales of newly built properties for local areas. Similar local data may be derived from online property web sites. As well as identifying change in the local housing stock these sources also provide indications of areas where there has been a significant turnover of occupants that might have changed the socio-demographic nature of the area.
So there are ways to identify a local area, or ideally a street, where there has been either significant development or a change of residents. If we know which streets to look at, we may see changed areas using tools such as Bing Maps and Streetview�, which let us �see them� as they are being built � as our two pictures show. Unfortunately this is labour intensive. Moreover, such pictures only tell us about the property; they do not let us look inside the front door and learn about the people living there. However, this does at least give us a visual check to validate any method of understanding change.
The datasets discussed so far give information about the housing in areas that have changed. To keep a segmentation up to date we need to understand how the people have changed and who is currently living in that housing.
Unfortunately many of the data sources that are typically used to keep socio-demographic information up to date are not good at noticing changes very quickly. For example, lifestyle databases are traditionally a source of street level information, but it can be a number of years before they gather enough information to notice the change. The reason seems clear � few people who move into a new house consider it a priority to inform the organisations that use their details for marketing. It takes a few years to rebuild the density of data necessary to give a solid picture for local neighbourhoods and streets.
Using a mix of sources
Some local socio-demographics are published by government. The Office of National Statistics neighbourhood statistics site is one source of data derived from administrative databases. Often data is published for quite local areas, lower level super output areas1. While this is not a geographic unit favoured in the private sector the techniques required to process the data for other geographic units is well established. Since it covers a number of universal benefits the data identifies local changes in some useful socio-demographic groups; pensioners, children, and single parents.
More local information can be obtained from some government databases. The Department of Work and Pensions publishes small area statistics for their databases of benefit claimants. This data identifies areas with high concentrations of those out of work � both long-term unemployment and the quarterly changes due to more recent job losses.
By itself this information is insufficient to provide a full range of truly local information. However, private sector databases can fill some gaps. People have been able to opt out of the electoral roll for many years, but there are other well-established databases and merging a high number of permissioned data sets can go a long way to creating a similar file. From this it is possible to derive good local estimates of changes in family or household structure and it is possible to see indications of changing concentrations of some ethnic groups.
The end result of these, and other techniques is that we can form quite detailed conclusions about very local changes.
So, to finish, let�s go back to our two pictures. They are of recently built housing whose occupants are less likely to show up in many traditional databases. However, judicious analysis across many data sets enables us to classify these much-changed locations within our well established and clearly defined segments. From our analysis, we conclude that the picture on the left shows an area of people of ACORN type 19; suburban privately renting professionals, and the picture on the right shows ACORN type 10; Well-off working families with mortgages. The result is that we have an in-depth and up-to-date understanding of the type of people who live in these places and companies can make important, strategic decisions based on the information that our segmentations provide.
1On lower level super output areas (LLSOAs) � they�re geographical areas for collecting statistics for small areas, so the �output� refers to the information they yield to market researchers.England and Wales are currently segmented into 34,378 LLSOAs. Essentially, they are used to give an improved basis of comparison throughout the country because the units are more similar in size of population than, for example, electoral wards.
More information on LLSOAs here.
John Rae
Comments on this article

Want to share your thoughts...?
NOTE: Please note that this board is moderated, and comments are published at the discretion of the site owner.
|