MrWeb 21 Years Feature: Faster, Better, More
October 12 2020
Continuing our focus on Data Visualization, Debbie Senior, Toluna's VP Product Automation, looks at the 'need for speed', and other factors driving changes in the way we process, share and display data.

Data Visualization helps everyone understand information, and being fastest to that understanding is the key to giving companies a real advantage in an increasingly competitive world. Visually presenting data makes it easier to pull out insights and make it actionable, ensuring that business decisions are based on fact rather than outdated hunches or senior-management whims. Technological change affects all businesses at increasing speed, and with more and more data readily available it becomes critical to ensure it is easily digested to provide timely, actionable insights. So what are the key trends and what's driving them?
Major shifts in data visualization
The global economy is speeding up, and unprecedented changes such as the COVID-19 pandemic make the world more unpredictable than ever: it's critical that businesses understand the changes around them and can and react accordingly. Over the last five years, business demand for faster access to accurate and insightful data has focused suppliers' attention on speed and efficiency improvements in the path from research to data visualization to business decision. Five major trends can be identified:
- Democratisation of research
With the advent of accessible tools, previous barriers to entry for large-scale research have fallen significantly. Where prohibitive costs, lack of skilled staff and access to infrastructure may have made timely feedback impossible for all but the largest brands, the new generation of tools have all but knocked down the barriers. Smaller brands can now access actionable market research using accessible tools to collect, visualize and digest huge amounts of data.
Organisations are moving to data-driven decision-making and data-driven culture, and as they do so more people across departments and within all sizes of business bring their customer knowledge and skillset to understanding data. Accelerated collaboration helps provide targeted value to consumers, giving them what they want by providing products and solutions that are really needed in the marketplace.
- Simplicity
Packaged tools and end-to-end solutions have emerged that can power faster reactions and offer instant feedback to ensure businesses don't miss time-critical opportunities. Time needed for research has collapsed from being measured in weeks to days to hours, enabling more agile and confident business development.
Making the complex simple is the true aim of any data visualization tool, allowing less specialist users to concentrate on immediate insights, rather than concerns around technical issues of access to or reliability of data. With technology as the expert background enabler, businesses focus on using key insights to drive success.
- Collaboration
Businesses need to easily share insights with multiple stakeholders, as both quick insights and more diagnostic or detailed explorations need to be seen at time-critical decision points.
The ability to share well-presented data across departments and levels of stakeholders, as well as to create reports with colleagues using a shared platform, fosters an accelerated level of effective collaboration. This is further enabled by the power of having a single login to access, merge and export data from a single platform.
- Flexibility
Interactive tools make it simpler to interrogate data in real-time for instant results, flexibility that enhances the potential for deeper understanding. The ability to filter information by gender, age or other demographics, or by different consumer types, allows an extremely granular picture of target markets to emerge with potential opportunities that may have been missed with less agile access to data.
Multi-layered access for different needs and stakeholders allows for a range of requirements, from immediate KPI summaries to the ability to delve into extreme details to substantiate decisions and explore further opportunities as needed.
- Automation
Integration of technologies such as machine learning (ML) and natural language processing (NLP) reduce the direct workload for humans while uncovering better insights through automation. AI-powered data visualization not only helps businesses find what they are looking for, but can also suggest opportunities that had not previously been seen.
Tools are continually expanding automation capabilities, supporting more accurate visualization with previously unseen speed and accessibility, and results can be gathered at a fraction of the cost of traditional methods.
Use of templates and automation drives higher-quality standardised inputs, resulting in stronger and more accurate insights. Further ability to extract data into the cloud, or to create APIs that link to companies or third-party reporting platforms enables even wider data integration.
Adapting to key industry trends
In a post-COVID, increasingly digital world, more than ever businesses need to understand and adapt to the 'new normal'. Finding a profitable way forward will depend on having access to up-to-date information on consumer behaviour in order to make sense of the massive scale of unexpected change. Businesses need to adapt quickly - or fail.
The rise of end-to-end research platforms that combine smart technology and expert research solutions feeding automated data visualisation, means that decision makers from all parts of the business and all backgrounds can quickly and easily get the answers they need with confidence, without deep research expertise.
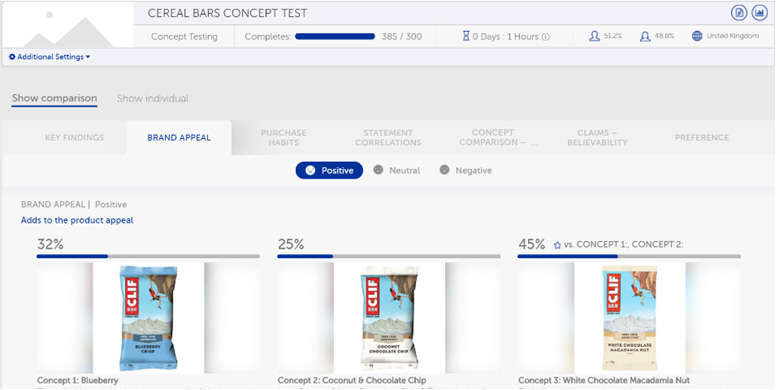
One platform leveraging emerging technology and offering a one-stop shop that lets you take control of your data is the new version of Toluna Start, released last month.
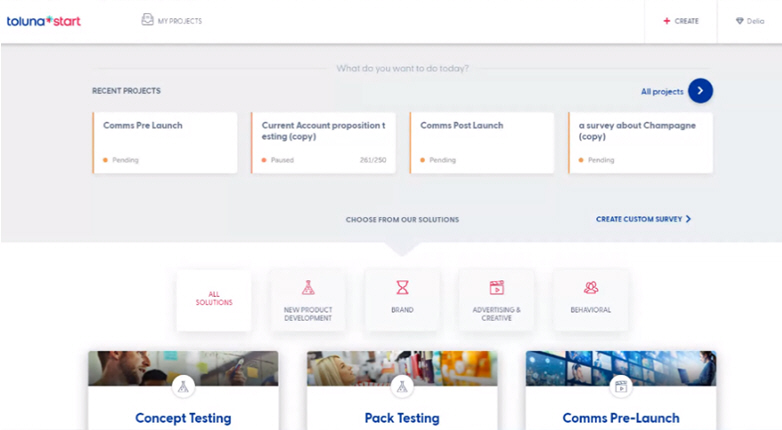
Toluna Start packages sophisticated research methodology and access to a massive number of consumers within a single ecosystem that means businesses are able to make sense of their data immediately. Data is accessible from the start and is easy to manage for different levels of understanding - critical when massive amounts of data are in use to facilitate better decision-making.
 Looking to the future
Interpreting data is a critical aspect of running a successful business, and will only get more so. Making the complexities of data as simple to understand as possible opens up unexpected insights and drives new, enlightened ways of thinking. Integration with different data sets and the ability to encompass bespoke or third-party data systems offers ever more detailed dashboards and comprehensive support for faster decision-making, while opening data up to wider audiences enables more productive collaboration to holistically benefit businesses.
The future may be unclear, in our world of accelerated and unpredictable changes, but the ability to quickly gather, interpret and act on valuable insights to support business success will remain a critical tool for all.
Debbie Senior - VP Product Automation at Toluna
Debbie is responsible for driving the strategy, creation, and growth of automated solutions on the Toluna Start platform that meet client / market needs, serviced or DIY, enabling clients to benefit from high quality, efficient insights for agile decision-making. She has a 20+ year research background with diverse expertise including research consultancy, product/solution innovation, commercial sales, training, and marketing.
Other 21 YEARS / Data Visualization content now available (read and download the
full supplement here):
A Dream Team to Fight Budget Cuts? - Great visuals and wide-ranging automation are a powerful combination for market researchers looking to justify budgets in the Covid era, says Confirmit Chief Product Officer Torbjörn (Tobi) Andersson.
All Change at Toluna - Paul Twite, Toluna's MD EMEA and LatAm, looking at the company's recent big announcements - rebranding and the launch of Toluna Start.
E-Tabs Guide to Good Data Viz - Six key considerations for creating clear and engaging visuals, from the team at E-Tabs.
Tip of the Iceberg Ipsos.Digital CEO Andrei Postoaca backs AI to unlock its full potential behind the scenes within ten years, allowing business needs to return to centre stage.
21 Years Feature: Medallia LivingLens CEO Carl Wong - Continuing our focus on Data Visualization, the LivingLens co-founder talks in-depth with MrWeb's Nick Thomas.
Beauty, Clarity or Both? - Joe Parker, Brand Director of London-based Motif puts an insight professional's spin on one of the longest-running debates in design.
MrWeb 21 Years Feature: Board Builder - Medallia's Senior Director of Product Management Vache Moroyan and his team are tasked with building dashboards that are a pleasure for research professionals to work with.
Didier Truchot on Finding Clarity in 2020 - Ipsos co-founder & CEO Didier Truchot talks about clients' need for clarity, AI's potential to change our industry, and why insight professionals should be confident about the future.
MrWeb 21 Years Feature: Data Viz and DIY Research - Ipsos.Digital CEO Andrei Postoaca talks about the challenges involved in developing a DIY research platform for one of the world's biggest and best known insight groups.
All articles 2006-23 written and edited by Mel Crowther and/or Nick Thomas, 2024- by Nick Thomas, unless otherwise stated.