Follow DRNO on...


Continuing our focus on 'Measuring Brains and Bodies', MindProber's Pedro Moreira looks at the company's use of electrodermal activity (EDA) to analyse the extraordinary success of the hit TV show. What worked best, and why? [Spoiler Alert: this makes reference to surprise scenes etc.] Pedro Moreira, PhD is the Head of Research at MindProber. He is also a postdoctoral researcher in quantitative methods and behavioral and neurobiological correlates of decision-making at the School of Psychology at the University of Minho.
What is electrodermal activity (EDA)? [NOTE - the industry knows the signal as GSR - galvanic skin responses - which, as explained below, is not entirely correct, as GSR is a subcomponent of EDA]. Instead of providing a standard scientific approach, let's look at what EDA is through the lens of the emotional signature of the hit show Squid Game, and illustrate how we can approach it in media research.
Record-breaker
By all accounts, Squid Game was a massive hit for Netflix with record-breaking views and the generation of amazing side effects like the all-time high sales of white Vans sneakers.
But why is the show so successful? Of course, distribution and network effects do contribute to its virality, but what is it about Squid Game that explains the public's response?
Attention-grabbing Scenes
Doing what we do, we sought to test the emotional signature of the first episode of the show. As expected, we saw a very high emotional response throughout the episode. However, we wanted to probe deeper and understand which scenes are the most effective in grabbing the public.
When we looked at the Squid Game EDA timeline (Image 1), something stood out: it looked like people were getting disengaged at the beginning of the show (hint: they were not).
Of course, people were super excited when (spoiler alert!) the doll started shooting brains out. That is an incredibly important scene because, curiously, people who watched the show for the first time disapproved of the scene at the conscious (dial) level, while repeat viewers loved it, with both groups showing a high emotional response. This showed that the scene sinks into people's minds, and they come to embrace the cruelty of the show.
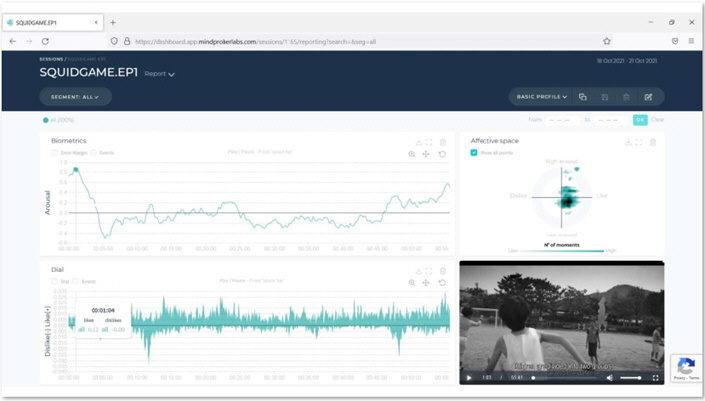
Image 1 - MindProber Engagement Timeline
This 'curious' EDA timeline, combined with the popularity of the show, seemed like the perfect excuse to use Squid Game to write a simple introduction to EDA for non-experts, and how to make sense of it in media research. So, what do we look at when we look at EDA in response to a show? And how do we plot it in our dashboard?
EDA Tonic and Phasic Components
Electrodermal activity is the variation of the electrical conductance (the opposite of resistance of the skin) in response to sweat gland activity. Think of the extreme scenario where you get very nervous and you can feel your hands sweating - EDA detects these changes at a micro level.
At a basic level, the EDA signal can be seen as a combination of what is termed tonic and phasic components. The tonic activity (Skin Conductance Level) is the very slow-moving component which, for our purposes, reflects the emotional tone of the viewer. The phasic activity (Skin Conductance Responses or Galvanic Skin Responses - GSR) is a faster component that may reflect electrodermal responses to external stimuli - these responses typically appear from 1-3 or 1-5 seconds after the stimulus and are measured in absolute units. The way we decompose the signals into these components (and this is standard in research) is by using what is termed a nonnegative deconvolution algorithm. We don't just look for peaks above a given amplitude, since this would fail to identify responses that overlap in time - a participant can respond to multiple stimuli in sequence without ever going back to a baseline level. In addition, nonnegative deconvolution algorithms can be automated in a very robust way.
So, for our purposes, the timeline we get, which we standardize within subjects and call emotional arousal on our dashboard, can be broken down into the tonic and phasic components (Figure 1).
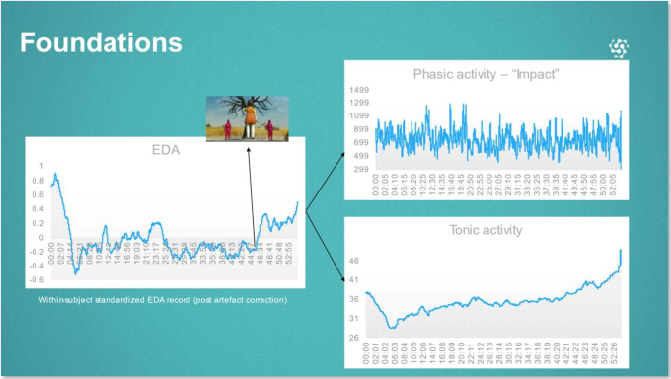
Figure 1 - EDA tonic and phasic components, MindProber dataset
While both have been related to emotional arousal (Moreira et al., 2018), we choose to use the standardized EDA as a measure of overall emotional experience, while using the phasic component as a more discrete measure of response to stimuli, or scenes, given that this is a good measure of event-related activity.
When we look at the Squid Game timeline, with the expectation around the show and people knowing what they were about to see, people start the show with very high anticipation. This causes them to be in a higher-than-normal baseline level. That is why (1) baseline correction is not perfect as a technique in these types of studies and (2) you should not use baseline-corrected (tonic) EDA to compare data across studies.
Figure 2 shows the phasic activity component averaged into 5-minute blocks. Here we see a slight reduction in GSR from the beginning of the show until minute 10, but these are still very high values compared to what we usually see in entertainment: although lower than the average of the episode, this block alone is still 48% above our benchmark.
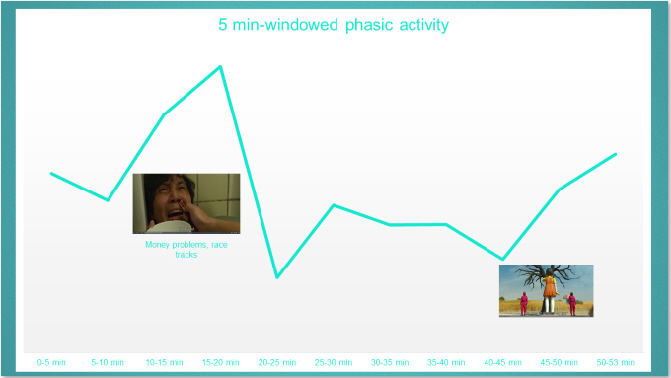
Figure 2 - Phasic activity averaged into 5-minute blocks
What we see after this block, however, is that the scene where the tragedy of Seon Gi-hun's life starts to unfold and the first brutal scene at the race tracks toilets are key in grabbing viewers' attention (more than the doll scene itself) and then the show takes them on an emotional roller coaster that culminates with the revelation of what the game is all about (all while never losing the background emotional tone, as seen in the steady/increasing tonic levels after minute 5). What's awesome here is that not only do you see an amazingly executed cliff-hanger, but that the producers were able to insert a very early emotional block without which, we would bet, the fate of the entire series could have been different.
But back to our original purposes, by separating the tonic and phasic components, not only do we get measures that can be related to different psychological aspects (some of our clients refer to them as Sustained engagement vs. Spiked excitation), but that, via phasic response, you can get an absolute measure of emotional reactivity that may be used to benchmark and compare across events.
Web site: www.mindproberlabs.com .
MrWeb's 'Measuring Brains & Bodies' supplement, sponsored by MindProber and developed in association with HCD Research, will be published later this month as a pdf document, with a dozen articles on applied consumer neuroscience and related topics, and is free to read and download.
SEE ALSO other pieces from this supplement published as articles on DRNO:
Neuro Best Practice Guide - March 1 2022
Neuroscience Techniques and Best Practice #1 - February 24
Podcast / video interview: Neuro-Guru Dr Michelle Niedziela - February 3 2022
Wearable Tech - Fit for MRX? - January 18 2022
Myths and Realities in Neuromarketing - January 11 2022
View the whole supplement in pdf format - download for free
All articles 2006-23 written and edited by Mel Crowther and/or Nick Thomas, 2024- by Nick Thomas, unless otherwise stated.
Register (free) for Daily Research News
REGISTER FOR NEWS EMAILS
To receive (free) news headlines by email, please register online